
Understanding Watchers on Stocktwits
Learn how the Watcher Count on Stocktwits measures long-term investor interest and track how many users are adding specific symbols to their watchlists.
Articles
- Why can't I post on Stocktwits?
- Using Sentiment on Stocktwits
- Understanding Watchers on Stocktwits
- Understanding Message Volume on Stocktwits
- How do I delete my account?
- How do I report a user?
- How do I sort my watchlist?
- How do I delete a message?
- Why doesn’t Stocktwits support OTC stocks?
- How do I stream messages in real-time?
- How do I reset my password?
- How do I follow someone on Stocktwits?
- What do the bullish and bearish buttons do?
- My account was suspended. What should I do?
- How do I post on Stocktwits?
- How do I filter my stream?
- How do I get a verified account?
- How to Change Your Email Address
- Why can’t I view someone’s profile?
- How do I unblock someone?
- I’m not receiving the password reset email.
- How do I block someone?
- I’m not receiving push notifications.
- How do I add a chart or image to the Stocktwits stream?
- Where can I see Stocktiwts' Privacy Policy and Terms of Use?
What are Watchers?
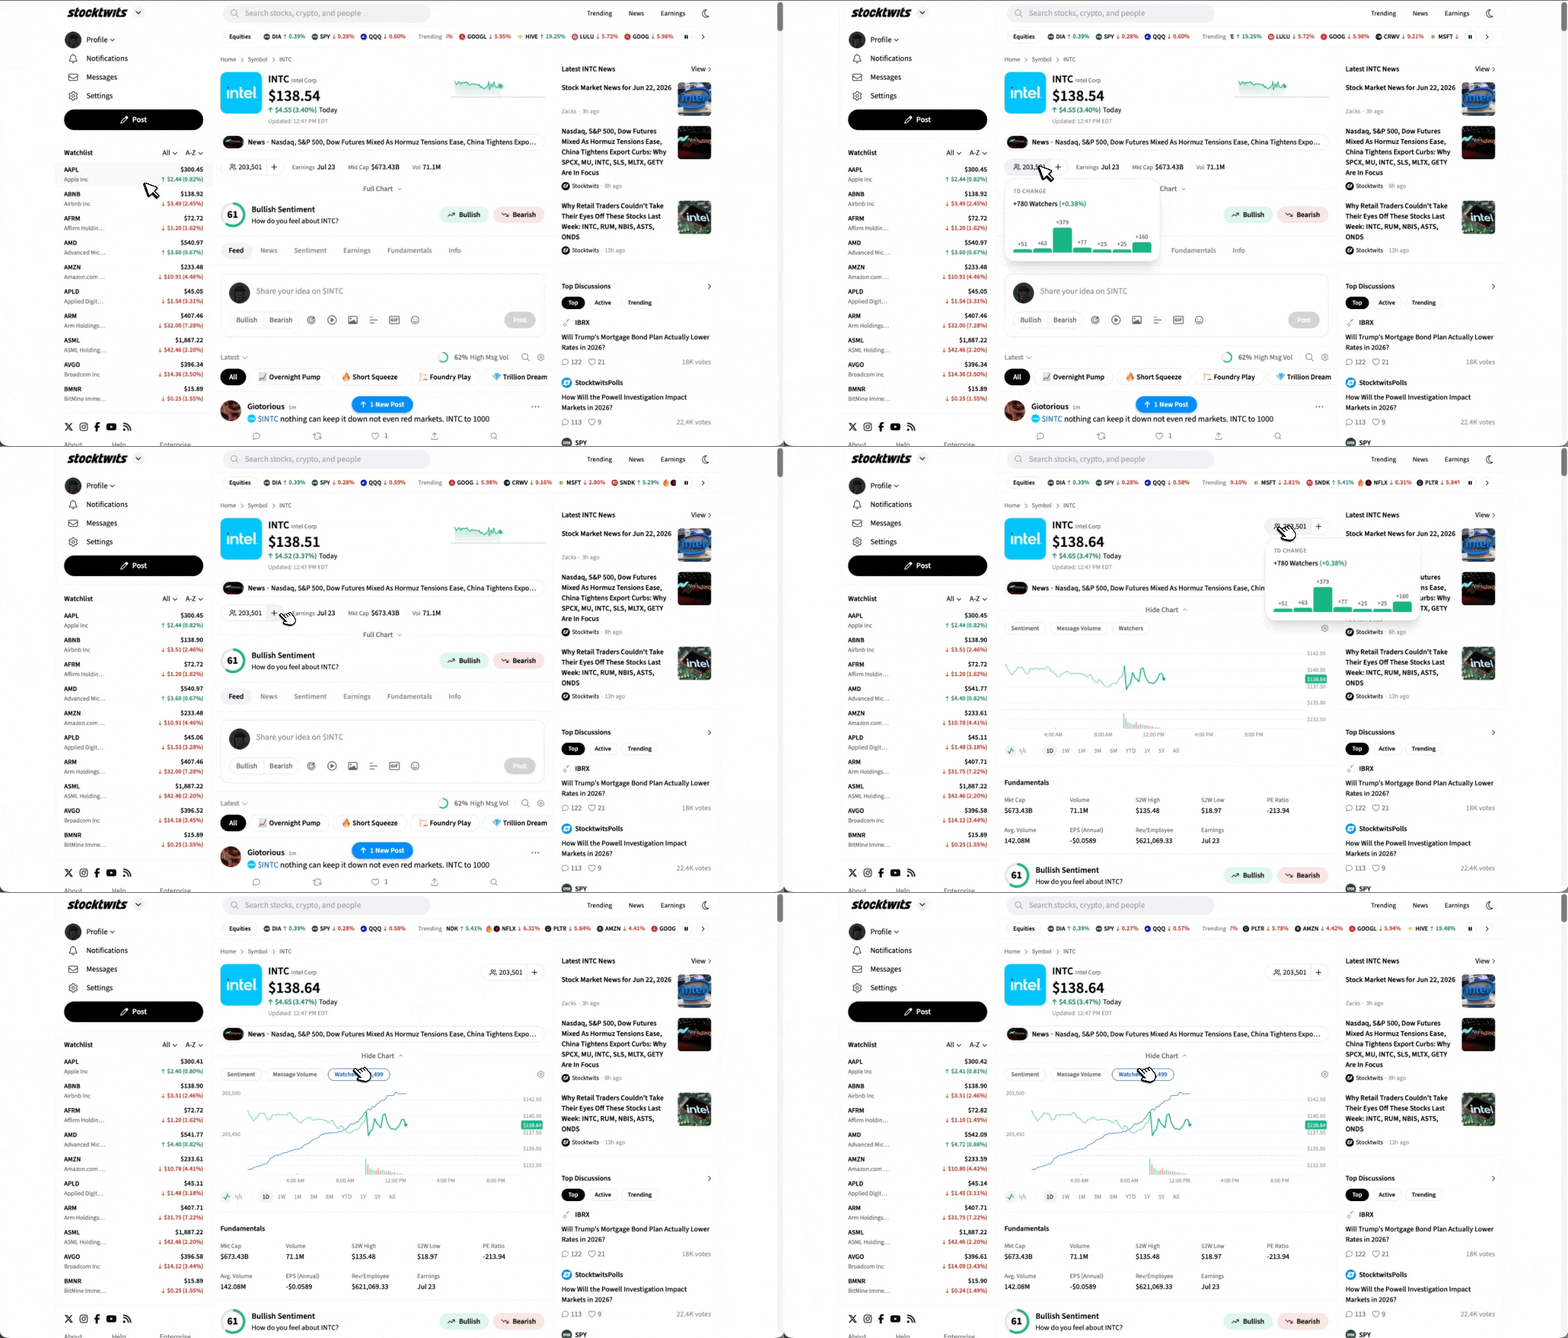
Watchers represent the number of Stocktwits users who have a symbol added to their watchlist.
Unlike Message Volume, which measures active discussion, Watchers reflect longer-term investor interest and can help identify symbols attracting sustained attention over time.
See It In Action
Case Study: SpaceX (SPCX)
Following the launch of Stocktwits’ private market pages, SpaceX (SPCX) quickly became one of the platform’s fastest-growing symbols.
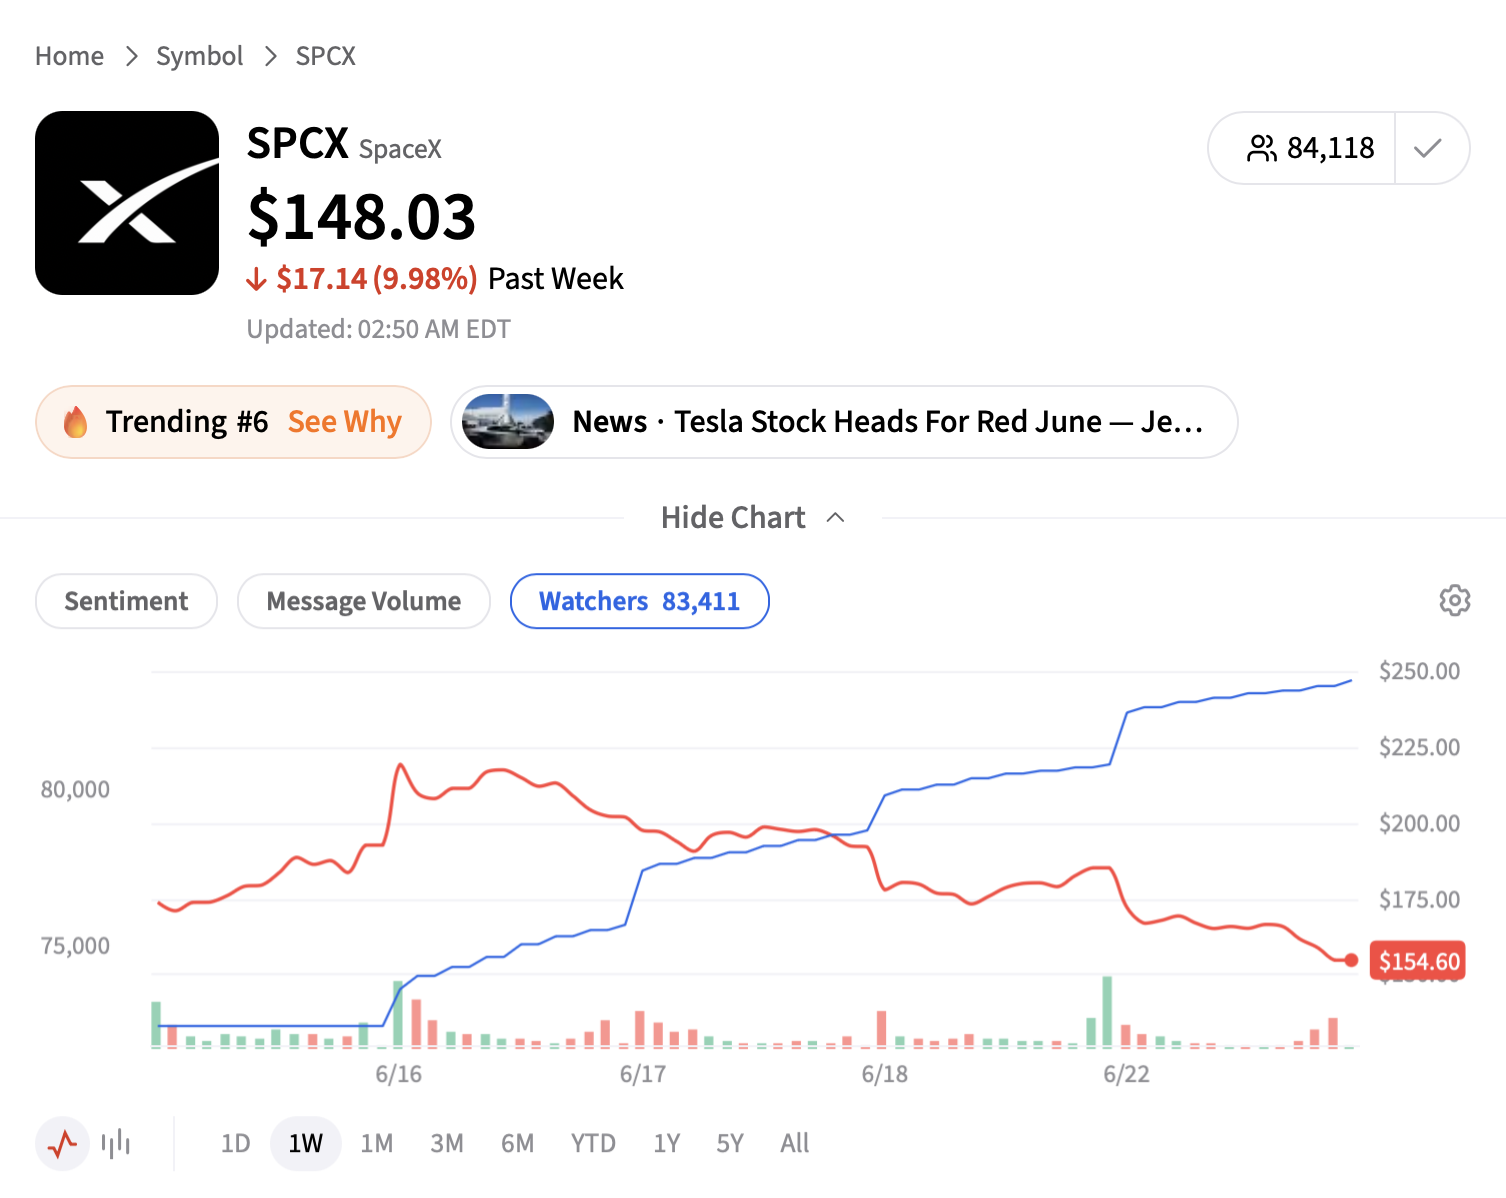
As more investors added SpaceX to their watchlists, Watcher Count climbed rapidly, reflecting growing retail interest in one of the market’s most closely followed private companies.
Watcher Count doesn’t indicate whether investors are bullish or bearish, it simply measures how many people are choosing to follow a symbol.
More Examples
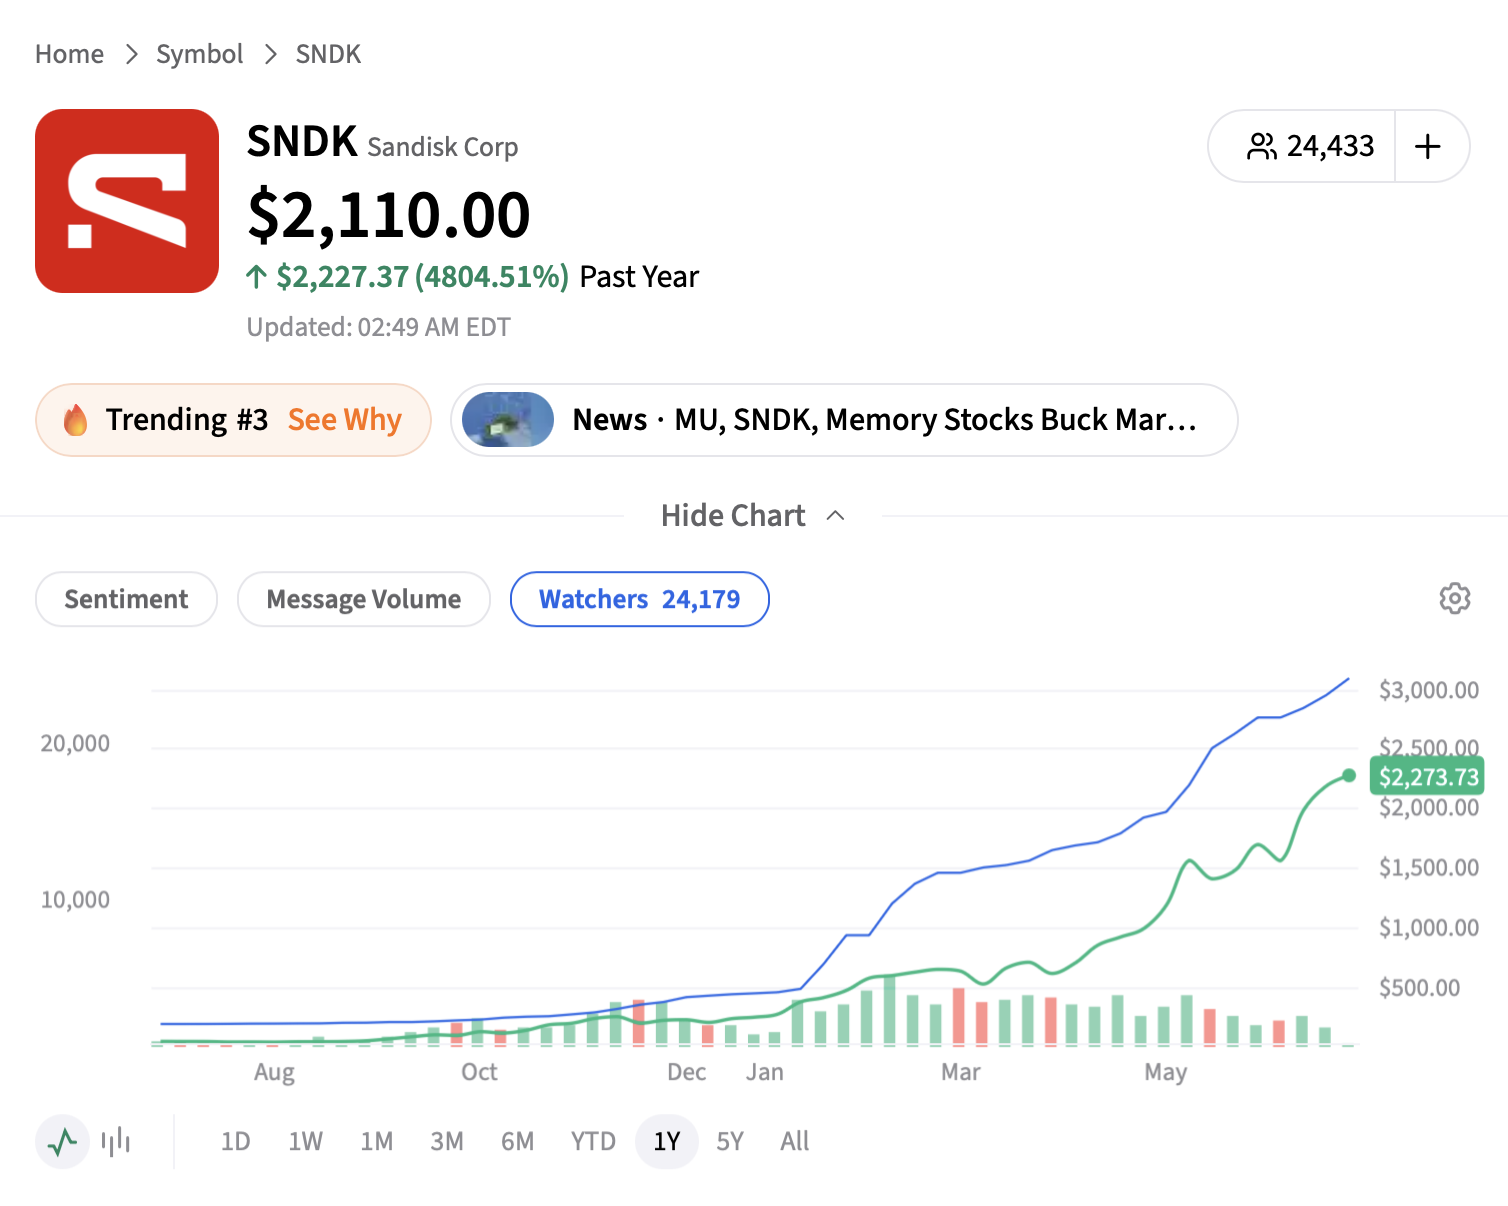
Sandisk ($SNDK)
Sandisk’s Watcher Count climbed steadily throughout its rally, reflecting sustained investor interest rather than a short-lived spike in attention.
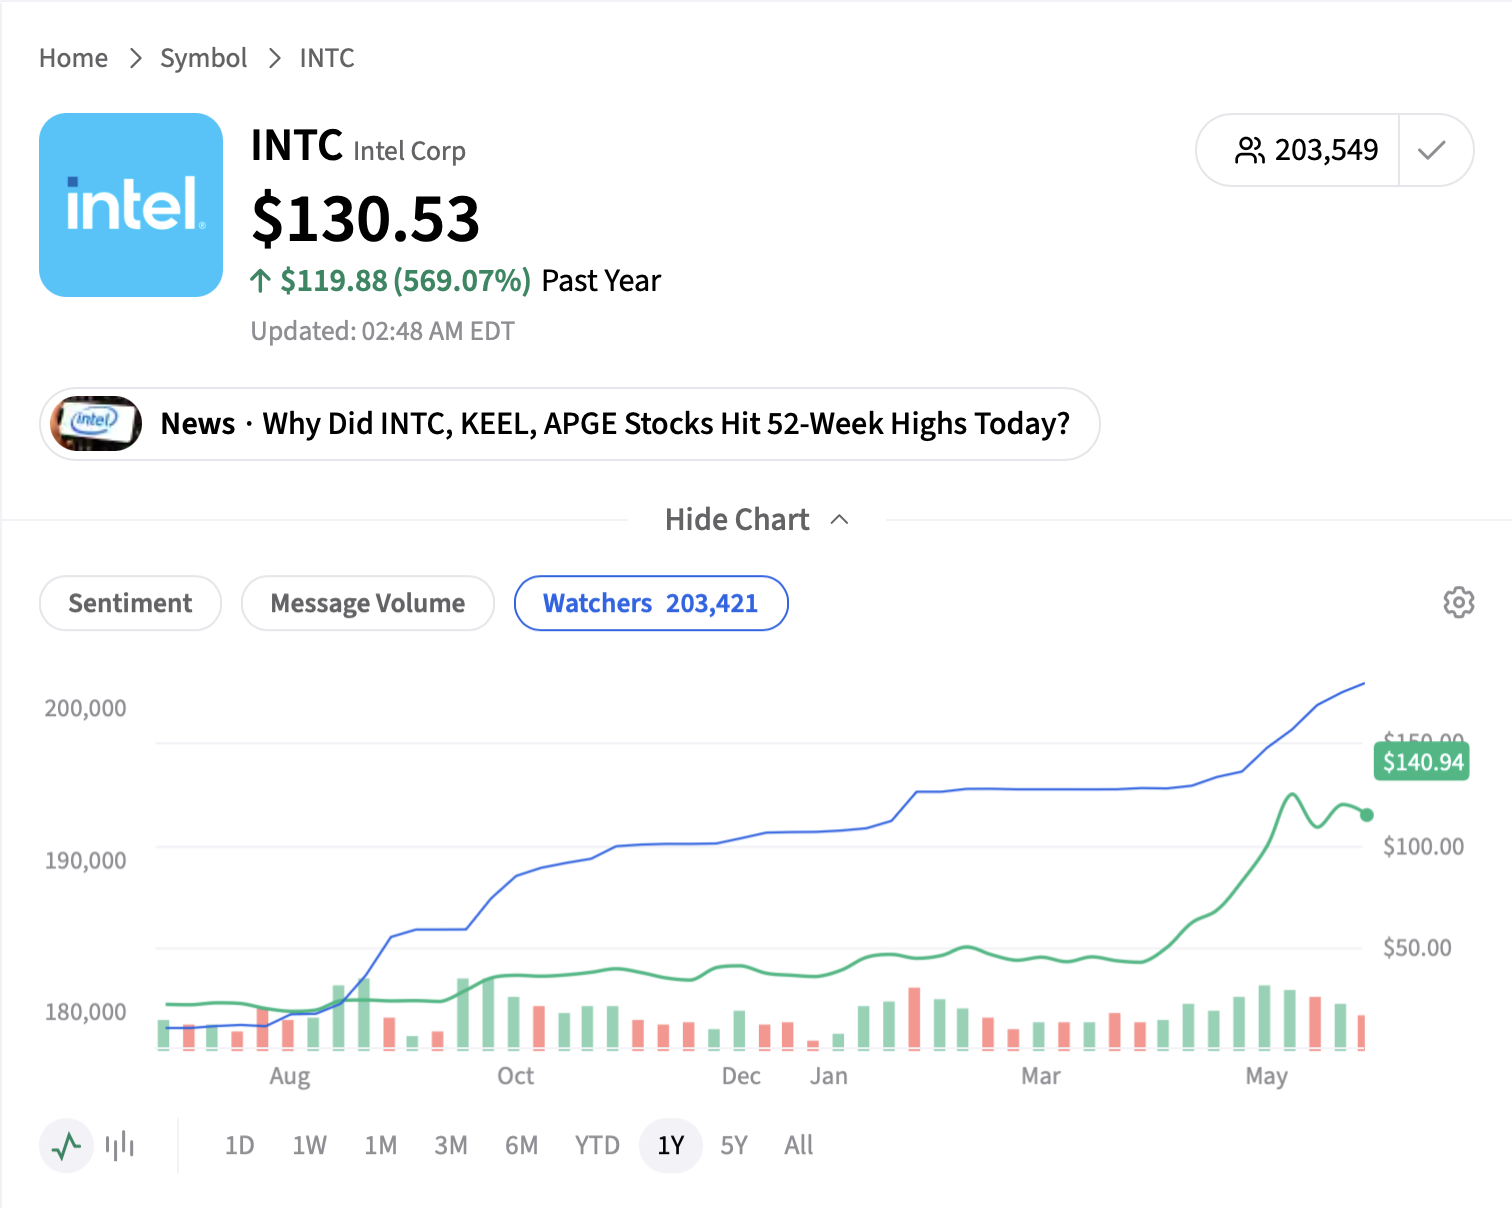
Intel ($INTC)
Intel also experienced consistent Watcher growth as investor attention returned to the company over the course of the year.
Why Watchers Matter
Investor interest often builds gradually. While Message Volume highlights what people are talking about today, Watchers can reveal which symbols are attracting sustained attention over weeks and months.
Watcher Count can help you:
Discover symbols gaining investor attention.
Monitor long-term retail interest.
Compare attention across symbols.
Identify companies attracting new investors.
What Does Watcher Count Measure?
Watcher Count reflects how many Stocktwits users currently have a symbol added to their watchlist.
Historical Watcher data lets you monitor how investor interest changes over days, weeks, months, and years.
Historical Watcher data makes it easier to distinguish between a short-term spike in attention and sustained growth in investor interest.
How Should I Use Watchers?
Watchers work best as a measure of growing investor interest.
Steadily increasing Watcher Count can indicate that more investors are beginning to follow a company, often before discussion activity reaches its highest levels.
Historical Watcher data and 52-week Watcher rankings can also help uncover “under-the-radar” symbols that are steadily gaining retail attention before they become widely discussed.
Combining Watchers with Sentiment and Message Volume provides a more complete picture of how the Stocktwits community is engaging with a symbol.
What’s Available at Each Access Level
Some Watcher data is available to everyone, while more detailed insights are part of Stocktwits’ registered and Edge subscriber experience.
Everyone (including signed-out visitors): Can see the current Watcher Count and the 7-day Watcher change for supported symbols. Day-by-day Watcher changes, chart overlays, and rankings are not available.
Registered users: Get access to the 7-day daily Watcher breakdown, making it easier to see how Watcher Count has changed over the past week.
Edge subscribers: Get full access to historical Watcher data, chart overlays across all chart timeframes, sector and industry rankings, 52-week high and low Watcher rankings, and all Watcher insights.
If you come across a locked or gated Watcher feature, signing up for a free account or upgrading to Edge will unlock it.
Have a question that wasn't answered here? Contact Stocktwits Support.